
Cold Chain Reporting Is a Dashboard That Tracks Temperature Compliance
OVERVIEW
Kroger needed better visibility into temperature compliance across their supply chain to ensure perishable goods stayed fresh and safe. They wanted a reporting tool that could provide clear insights for teams like business executives, category managers, retail operations, and food safety. The goal was to make it easy for these teams to track trends, monitor shipments, and address any issues proactively.
ROLE
Lead Product Designer responsible for driving the end-to-end design process, ensuring the final product met user needs and business goals.
Collaborated with developers, product managers, and data analysts, collectively referred to as the “fresh team.”
CONSTRAINTS
Limited access to real-time data, requiring the design to focus on delayed insights.
Tight deadlines to deliver a functional MVP within a few months.
Limitations with Power BI:
Limited customization options for advanced visualizations.
Challenges in handling large datasets efficiently without performance issues.
PROBLEM
Limited visibility into temperature compliance from the distribution center to stores made it challenging for stakeholders to monitor shipments and address potential issues efficiently. This lack of insight created risks for food safety and made it harder to ensure the freshness of perishable goods.
PRIMARY GOALS
01.
Create an Intuitive Dashboard
Ensure the interface is user-friendly for stakeholders, focusing on clarity and usability for efficient workflows.
02.
Enhance Data Visualization
Provide clear, actionable insights through charts and visual aids.
03.
Enable Stakeholder Decision Making
Allow stakeholders to quickly identify and prioritize critical issues for faster resolution.
04.
Foster Collaboration
Encourage cross-functional teamwork through a user-friendly and accessible dashboard.
Design Process
Onboarding
When I joined the Cold Chain Reporting project at Kroger, there were already some initial wireframes in place. My first task was to quickly refine these wireframes to ensure they were user-friendly, visually aligned with Kroger's design system, and ready for development. This work needed to be completed quickly to support the launch of the MVP.
STEP 1
Research & Understanding
The first step of the design process was to really dive into the project and get a clear understanding of its context and goals. I spent time reviewing the existing wireframes and joining stakeholder meetings to learn about their pain points and figure out what they needed from the tool. Working closely with the product manager, I made sure to gather as much information as possible to set the stage for the design work.
To better understand the users and how they worked, I created personas and journey maps. These personas represented key stakeholders like Category Managers and Supply Chain Executives, outlining their goals, challenges, and daily tasks. The journey maps showed the end-to-end process, highlighting pain points and areas where we could make improvements. These tools helped the team get on the same page about the users and guided my design decisions throughout the project.


Design Workshops
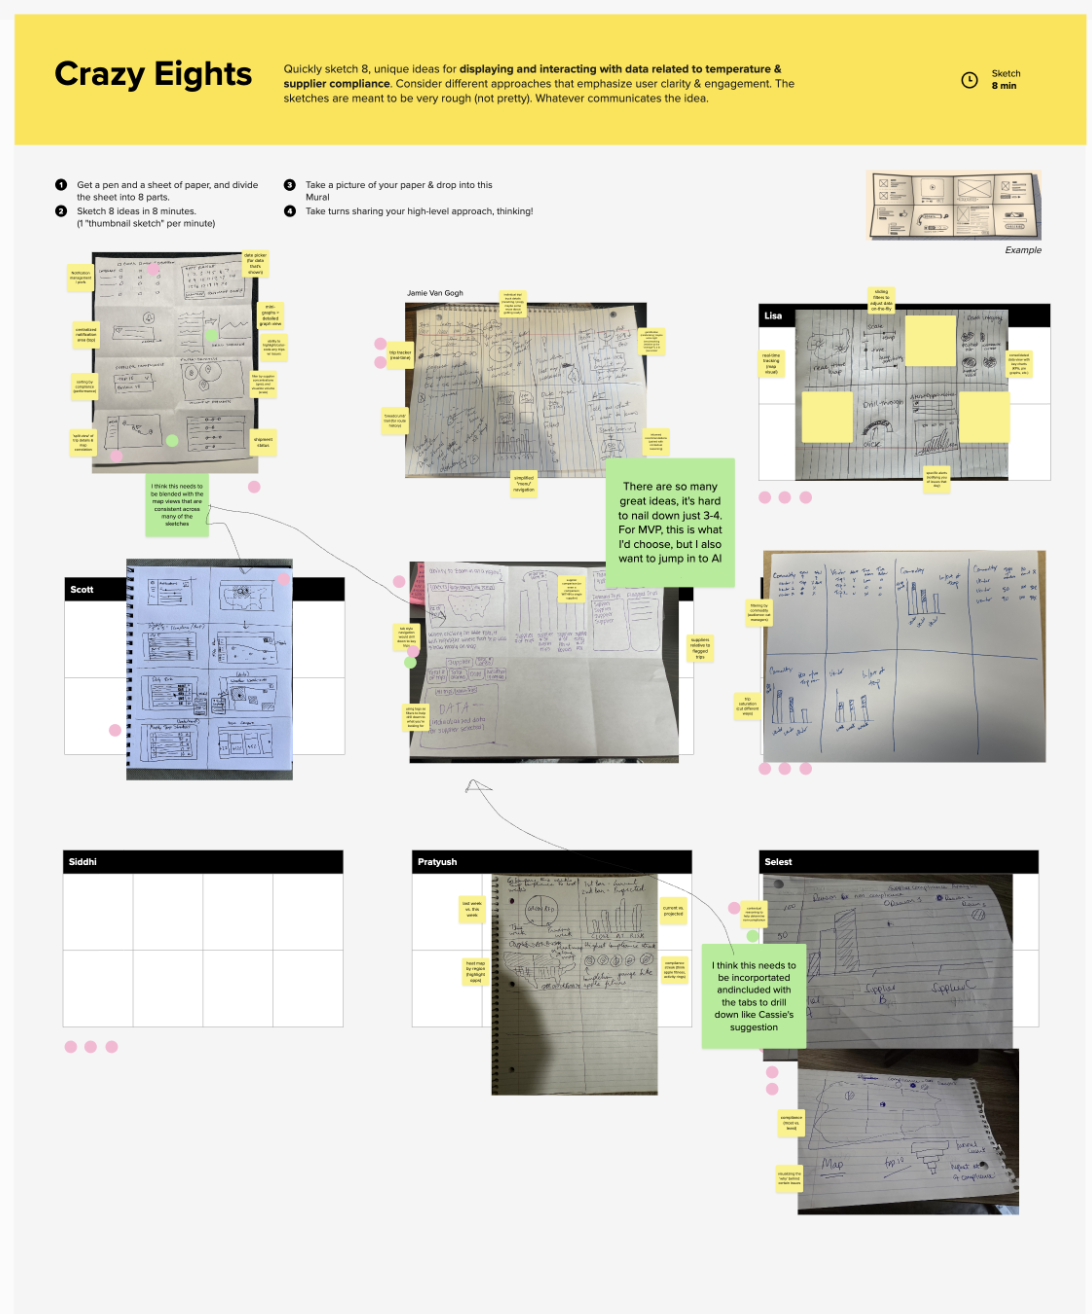
As part of the research and discovery phase, I also ran a series of design workshops using methods inspired by the LUMA framework. These workshops, including lightning demos, crazy 8s, and an art museum activity, helped the team brainstorm and align on ideas for the Cold Chain Reporting tool.
Lightning Demos: We looked at other dashboards and tools to see what worked well and what could inspire our designs. This helped us explore different ways to show the data and make the workflows more intuitive.
Crazy 8s: A quick sketching session where everyone came up with multiple ideas in a short amount of time. This helped bring out creative solutions and different perspectives.
Art Museum: We put all the sketches from Crazy 8s on display so the team could walk through, give feedback, and vote on their favorites. This made it easy to spot the strongest ideas and move forward with them.
These workshops gave us a lot of fresh ideas and got everyone on the same page about the direction of the project. They were a great way to kick off the design process and set the foundation for what came next.
STEP 2
Defining Metrics & Visualization
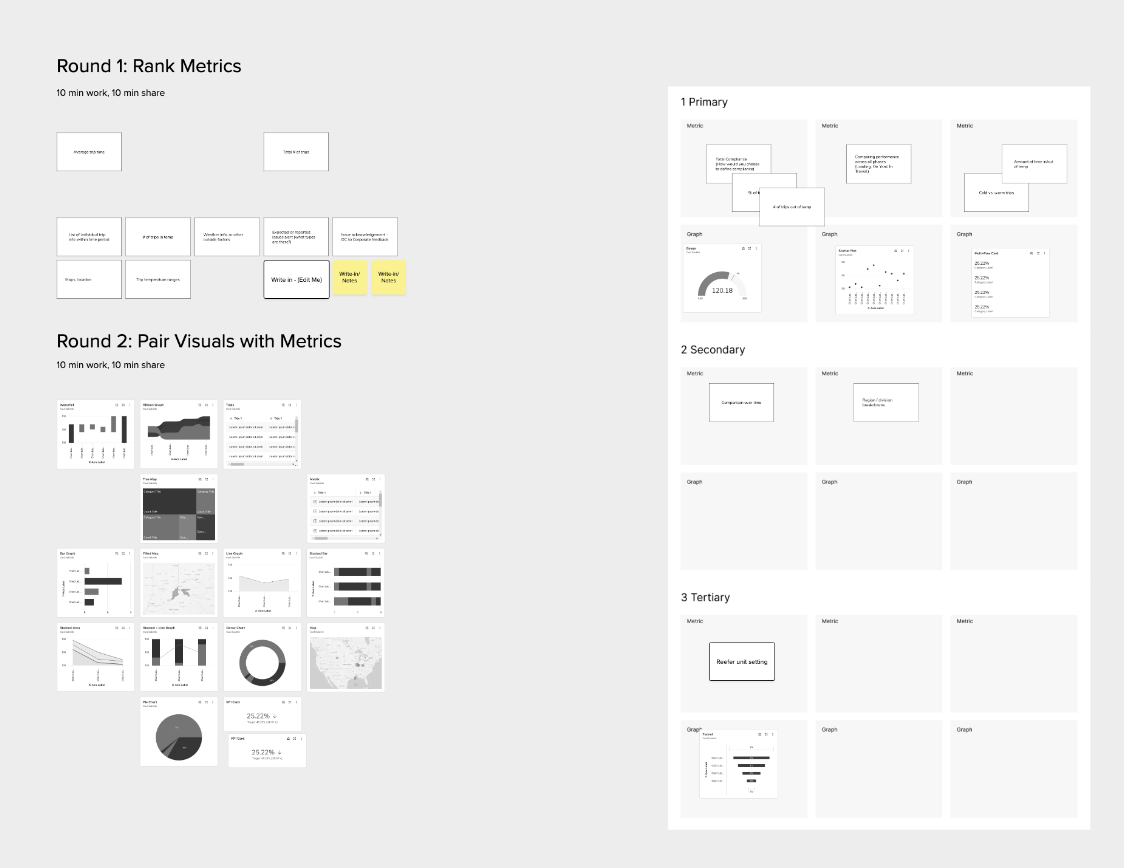
The next step was figuring out which metrics were most important to stakeholders and how to best represent them visually. I helped lead a card sorting activity where stakeholders ranked and organized the key data points they needed for the Cold Chain Reporting dashboard. This activity highlighted critical metrics like temperature compliance trends and shipment-specific details.
Once we had the priorities sorted out, we paired each metric with the right type of visualization. For example, we used line charts to show trends over time and tables to break down shipment-specific details in a clear and easy-to-read way. The goal was to make sure stakeholders could quickly understand the data and take action without overcomplicating things.
This process ensured the MVP was both useful and easy to navigate. It also gave us a strong starting point for refining and expanding the dashboard in future iterations.
STEP 3
Low-Fidelity Wireframes
The next step was creating low-fidelity wireframes to lay the groundwork for the MVP. Using insights from the discovery phase and the key metrics we prioritized during the card sorting activity, I sketched out initial layouts and workflows. The existing wireframes gave us a starting point, which I refined to better organize and present the information.
One of my main focuses during this phase was figuring out how to visualize a trip on a timeline graph. The goal was to show key temperature compliance data for shipments in a way that was clear and actionable for stakeholders. Power BI’s limitations made this tricky since its built-in visualizations weren’t flexible enough for something as customized as a timeline graph. To work around this, I came up with creative solutions and collaborated closely with the development team to make sure the design worked both visually and technically.

STEP 4
Internal Feedback & Iteration
The next step was gathering feedback on the low-fidelity wireframes and making updates to ensure they met stakeholder expectations and project goals. I worked closely with the product manager, developers, and other team members to share the initial designs and discuss ways to refine them further.
Stakeholders provided valuable input on how they wanted the data displayed and interacted with, which led to updates in the layout and functionality.
This process was critical for ensuring the wireframes were practical for development and aligned with stakeholder needs. By the end of this step, the wireframes were more polished and ready to transition into high-fidelity mockups.
STEP 5
High-Fidelity Mockups
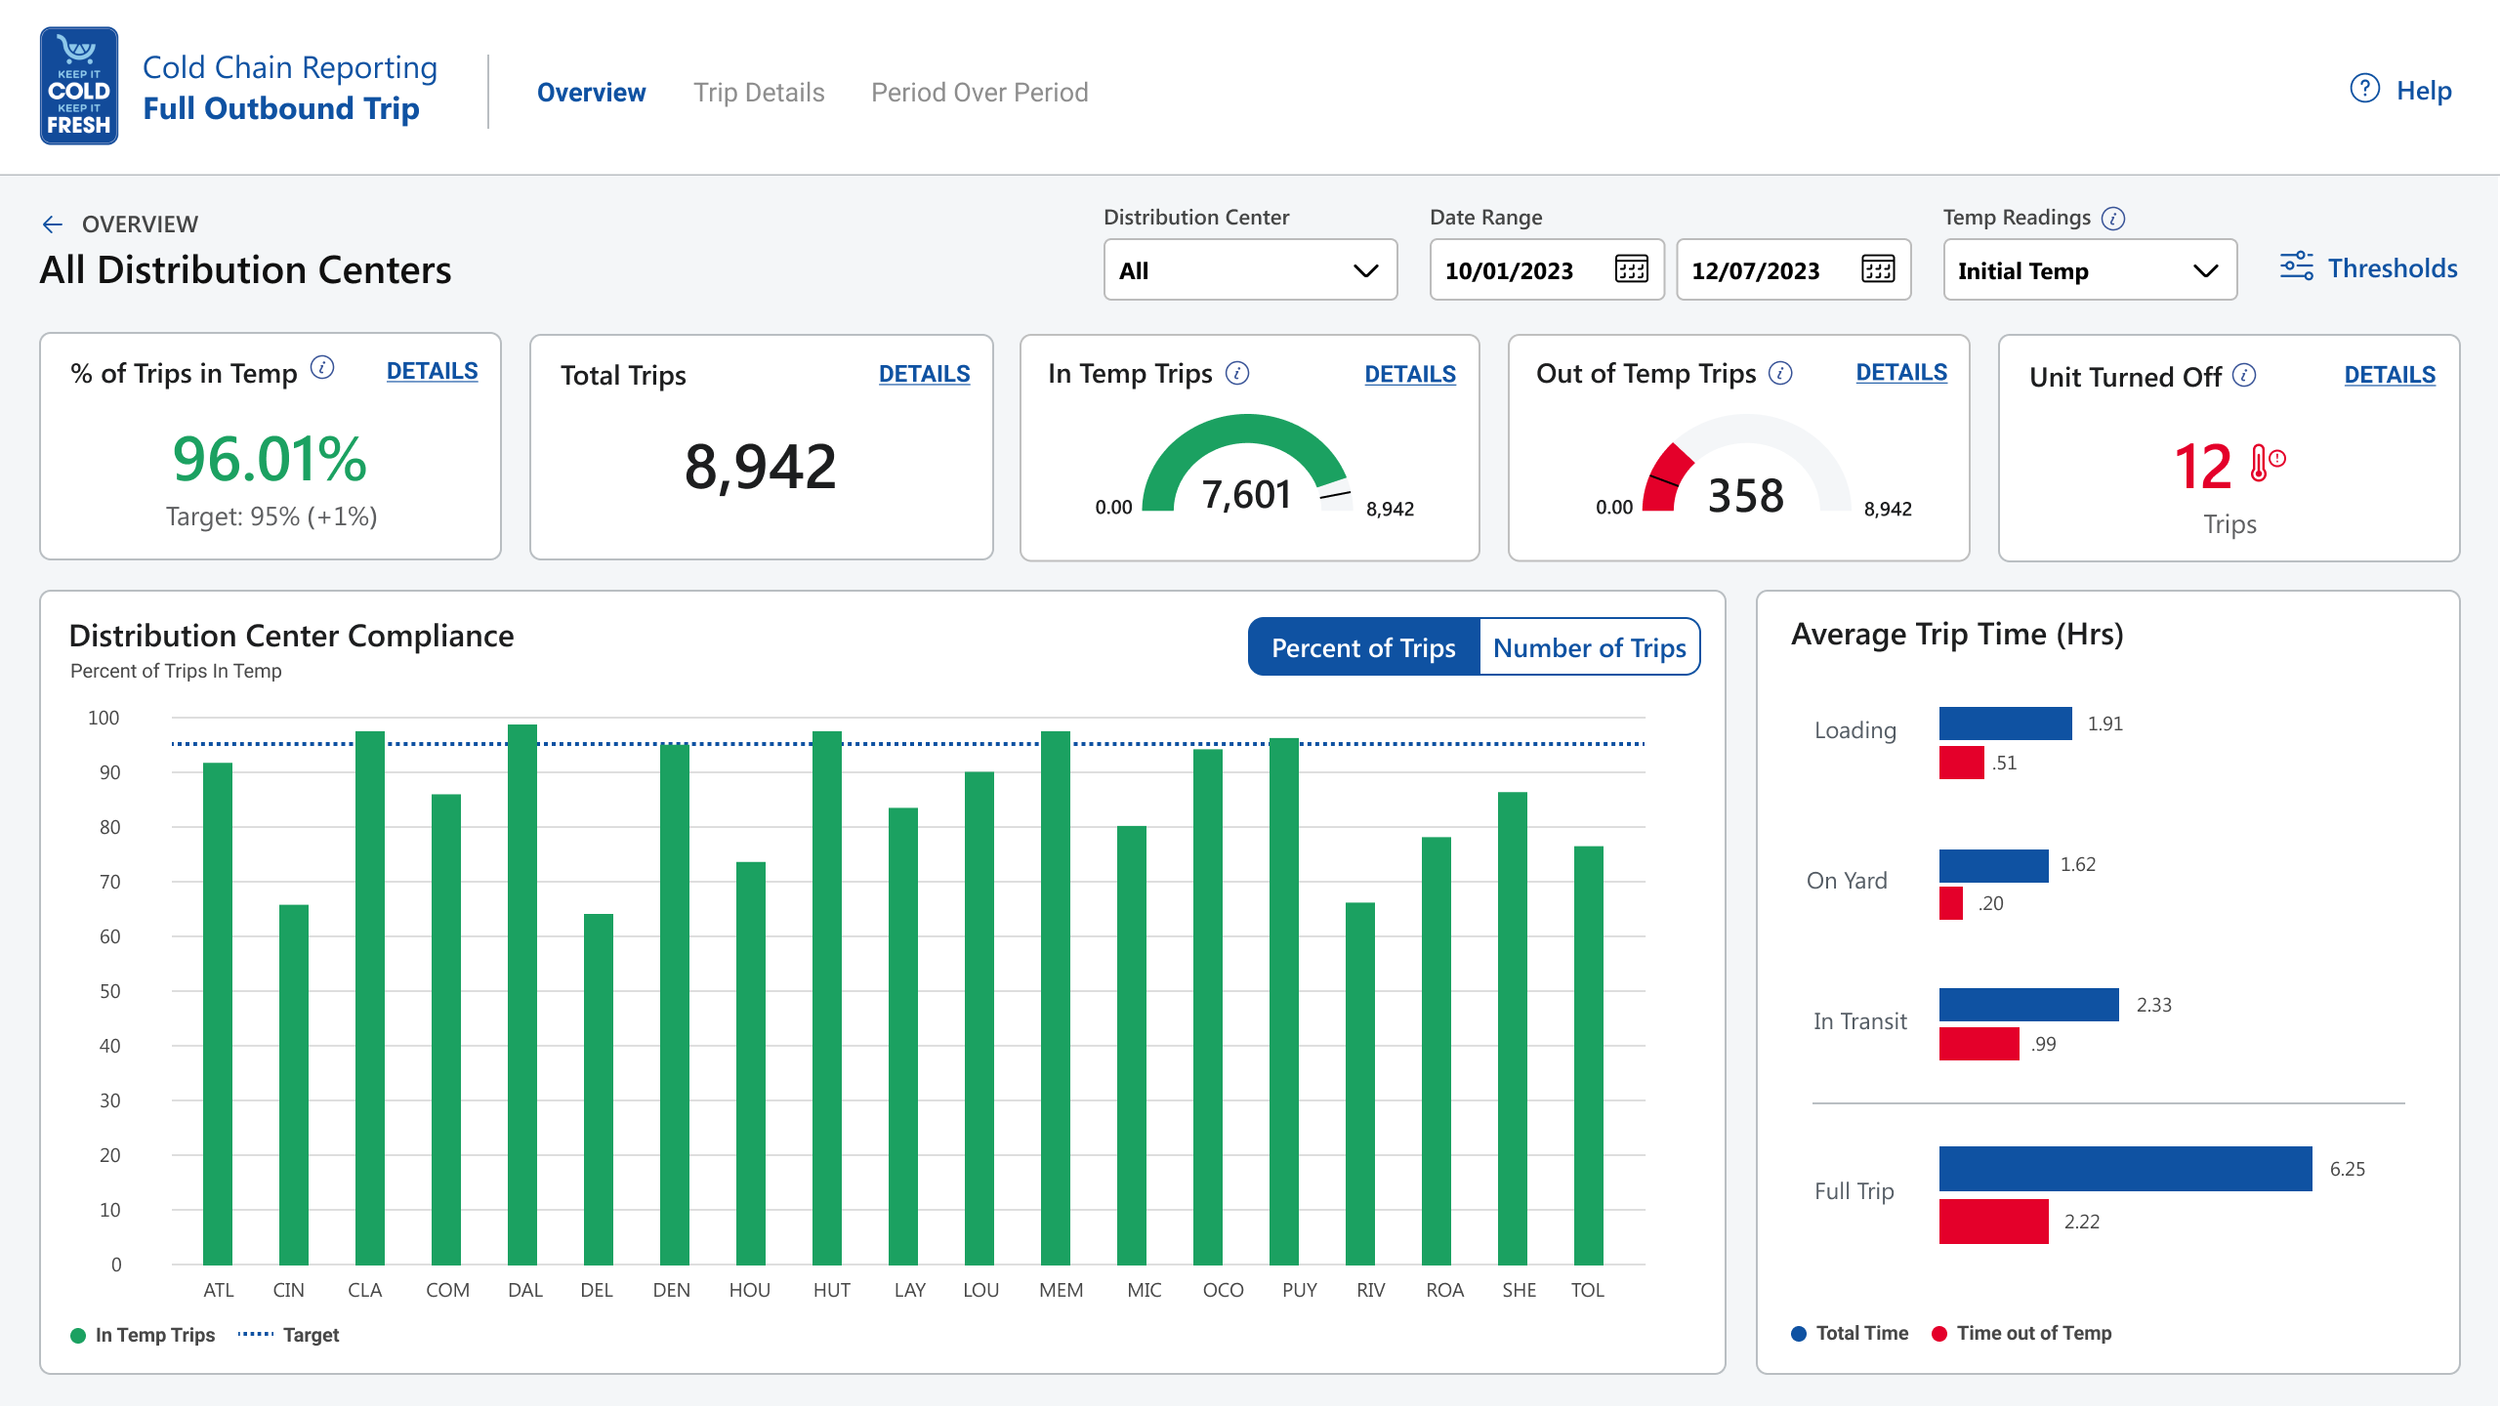
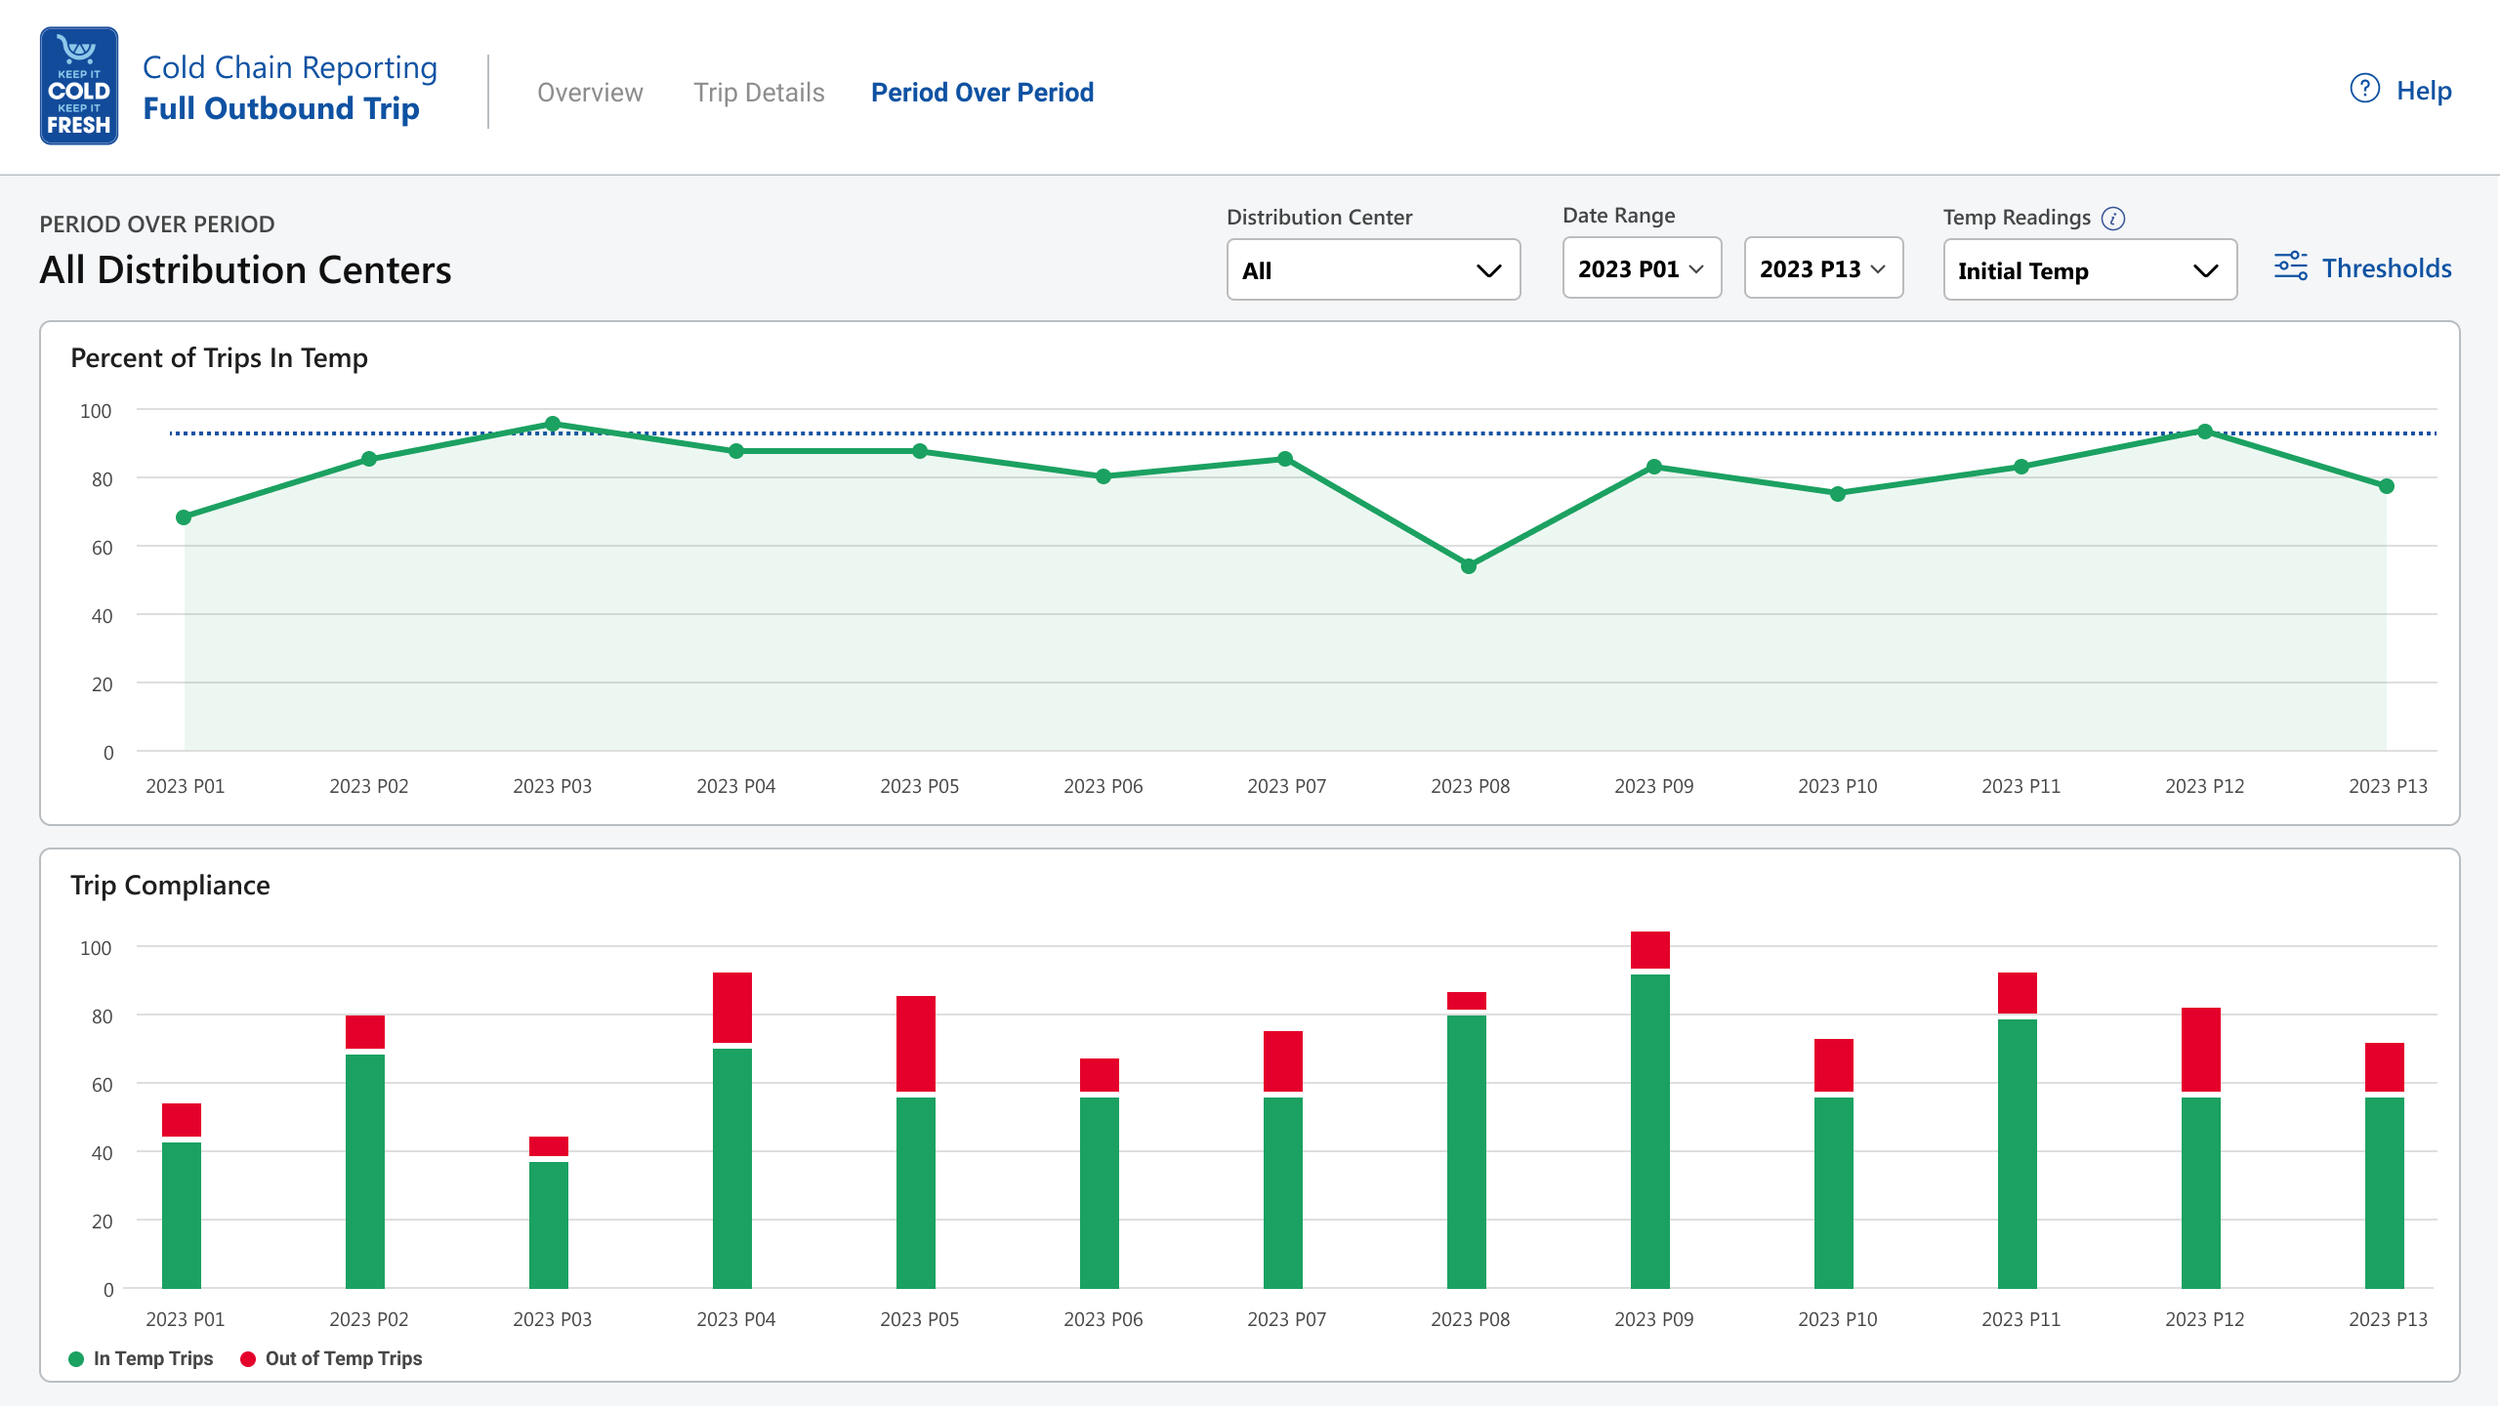
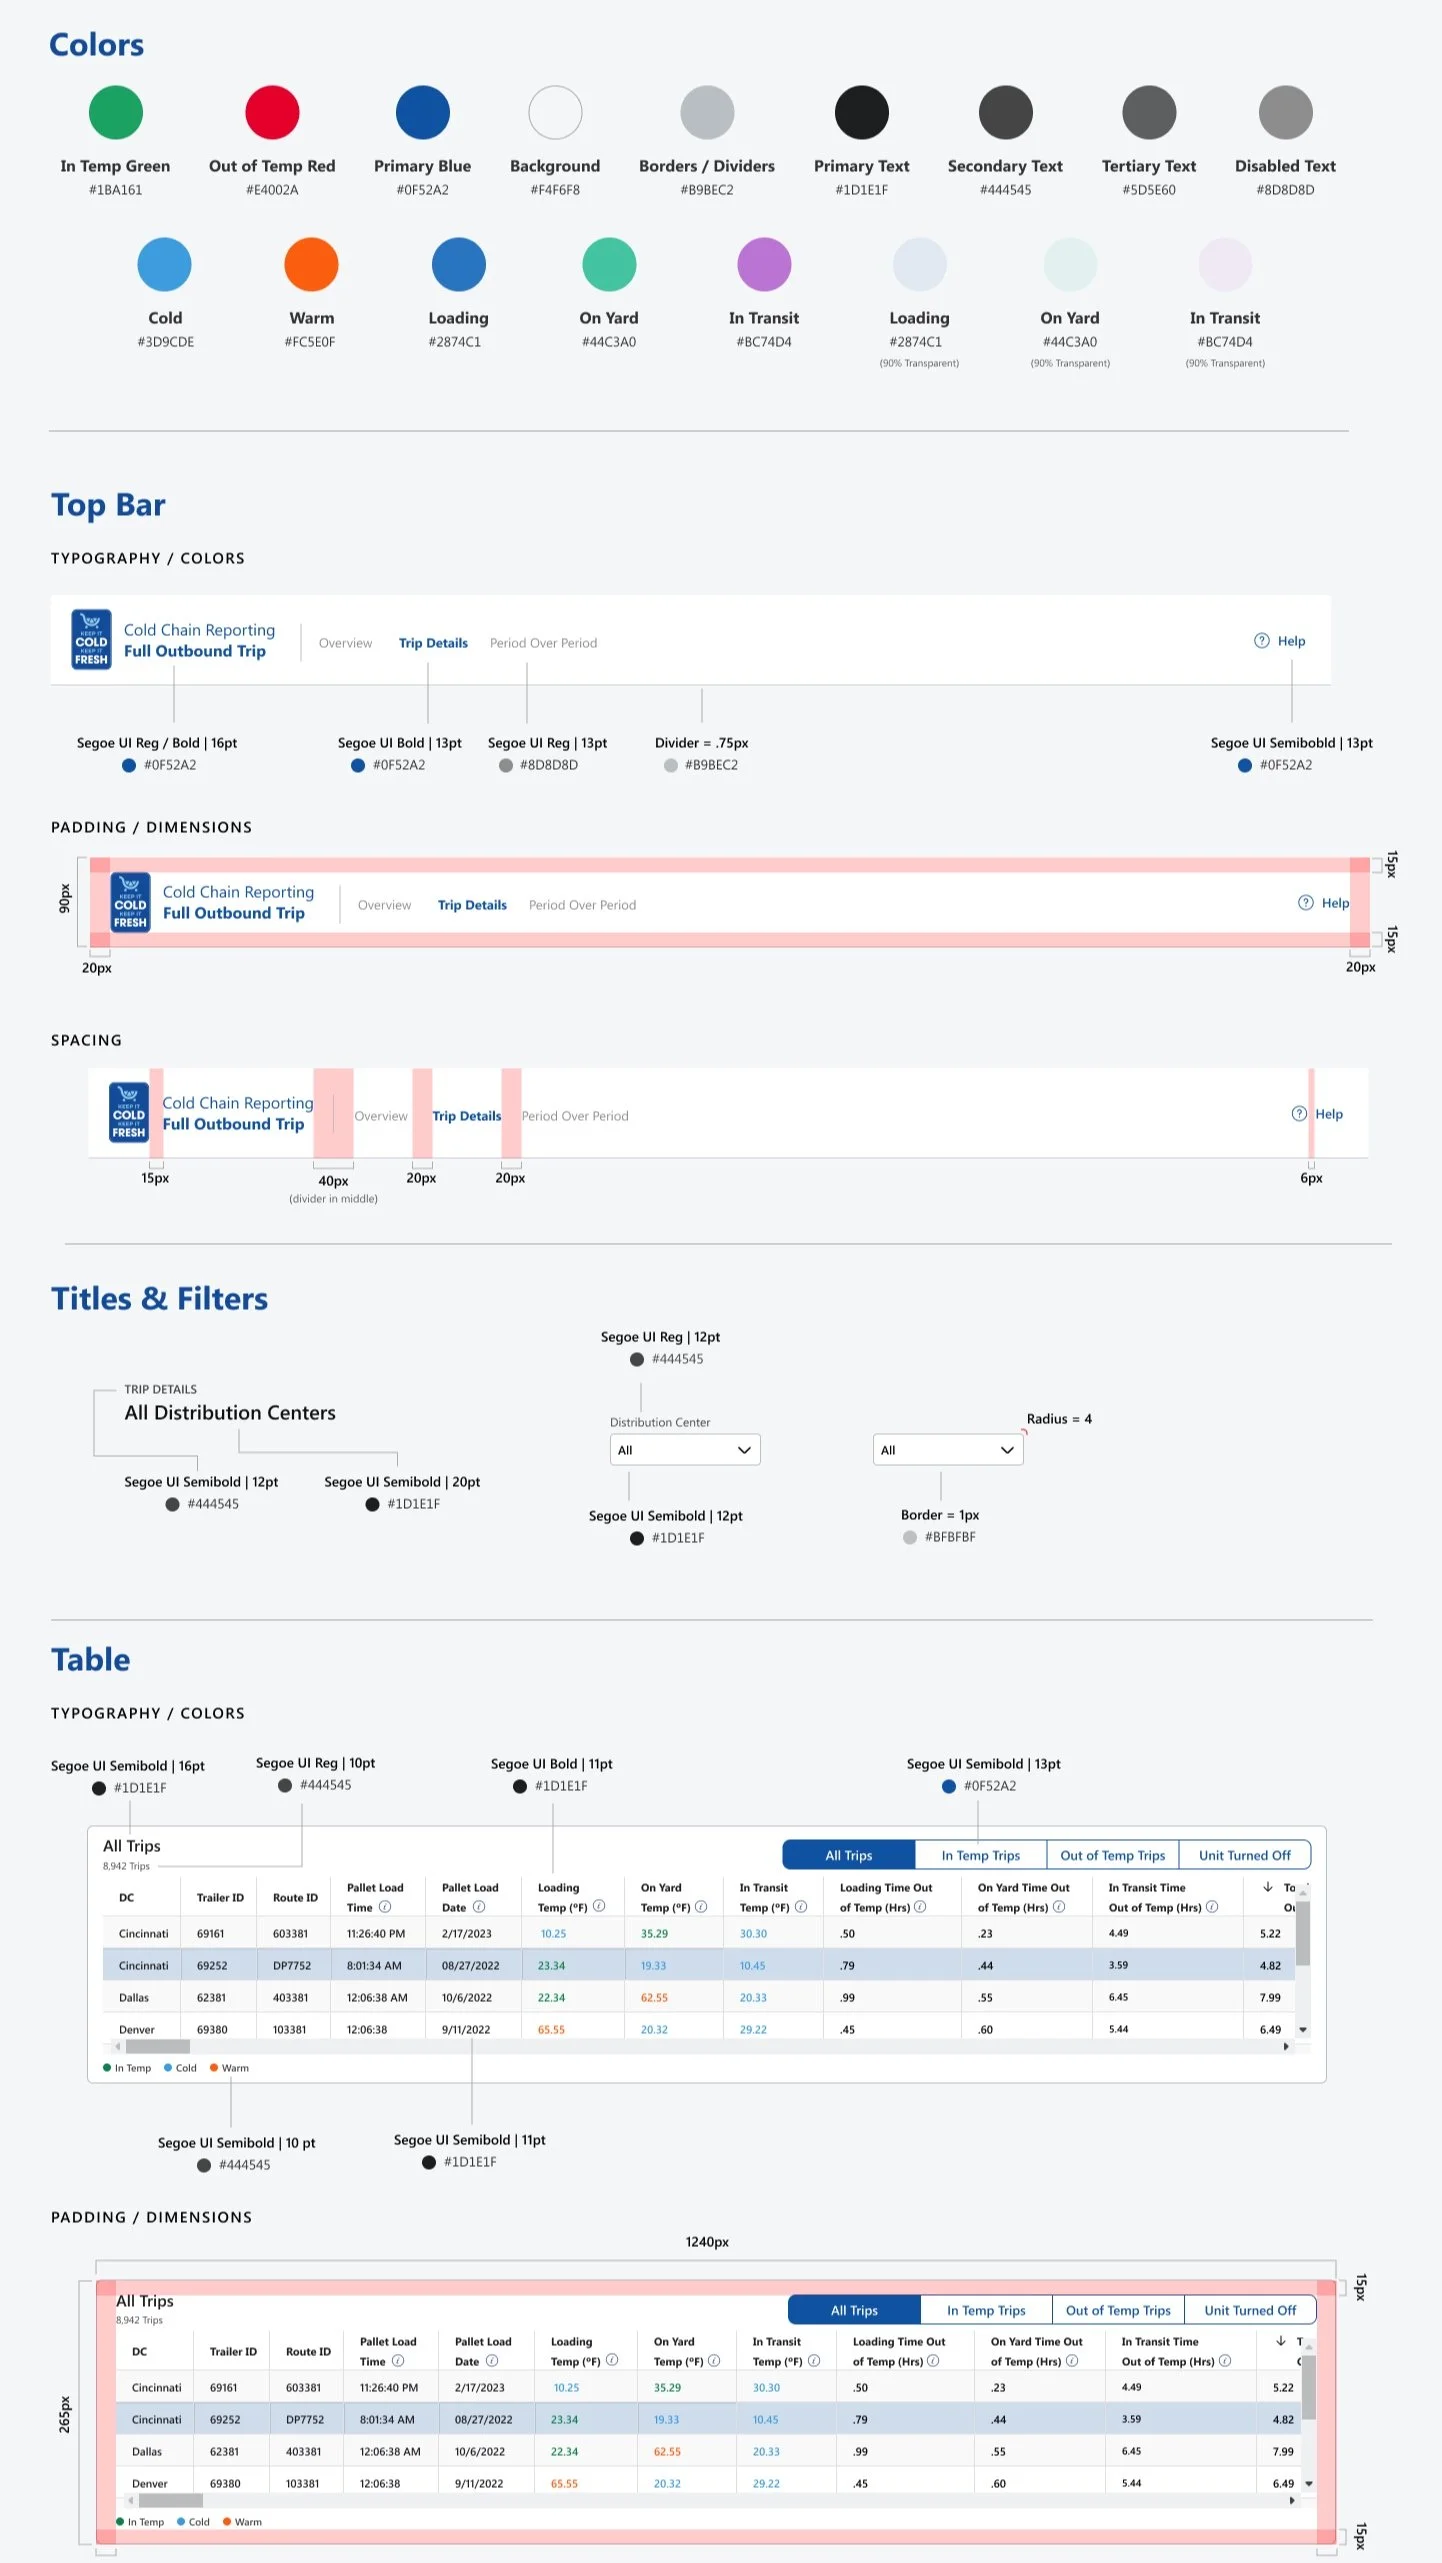
The next step was creating high-fidelity mockups based on the refined wireframes. This is where the designs really started to take shape, incorporating visual hierarchy, branding, and detailed interactions. At this stage, the Kroger design system was applied to ensure consistency with their guidelines for typography, colors, and components.

STEP 6
User Testing
After completing the high-fidelity mockups, the next step was conducting user testing to validate the usability of the design. The primary goal of this step was to ensure that stakeholders could navigate the dashboard easily, understand the visualized data, and effectively use the tool to make informed decisions.
I facilitated unmoderated user testing sessions with key users and they were given specific tasks to perform, such as:
Interpreting the timeline graph.
Accessing shipment-specific details.
Identifying anomalies in temperature compliance.
The feedback from these sessions helped confirm that the designs were intuitive and actionable, while also highlighting areas for improvement.
STEP 7
Handoff to Developers
The final step in the process was handing off the high-fidelity mockups to the development team for implementation. My focus during this phase was to ensure the developers had all the resources and clarity they needed to accurately bring the designs to life.
The handoff included:
Annotated Mockups: I provided detailed annotations for each component and screen, explaining functionality, interactions, and layout specifics to ensure everything was clear during implementation.
Design Specifications: A style guide was shared, outlining details such as spacing, typography, colors, and component usage, ensuring consistency with the Kroger design system.
Developer Collaboration: I collaborated closely with the development team to answer questions, provide guidance, and address technical challenges as they arose.
Regular communication with the developers ensured the designs were implemented as intended, and any issues were resolved promptly. This handoff phase was critical to maintaining the integrity of the design and ensuring the final product aligned with stakeholder expectations.
Thank you for reading my case study!
Check out some of my other work below.
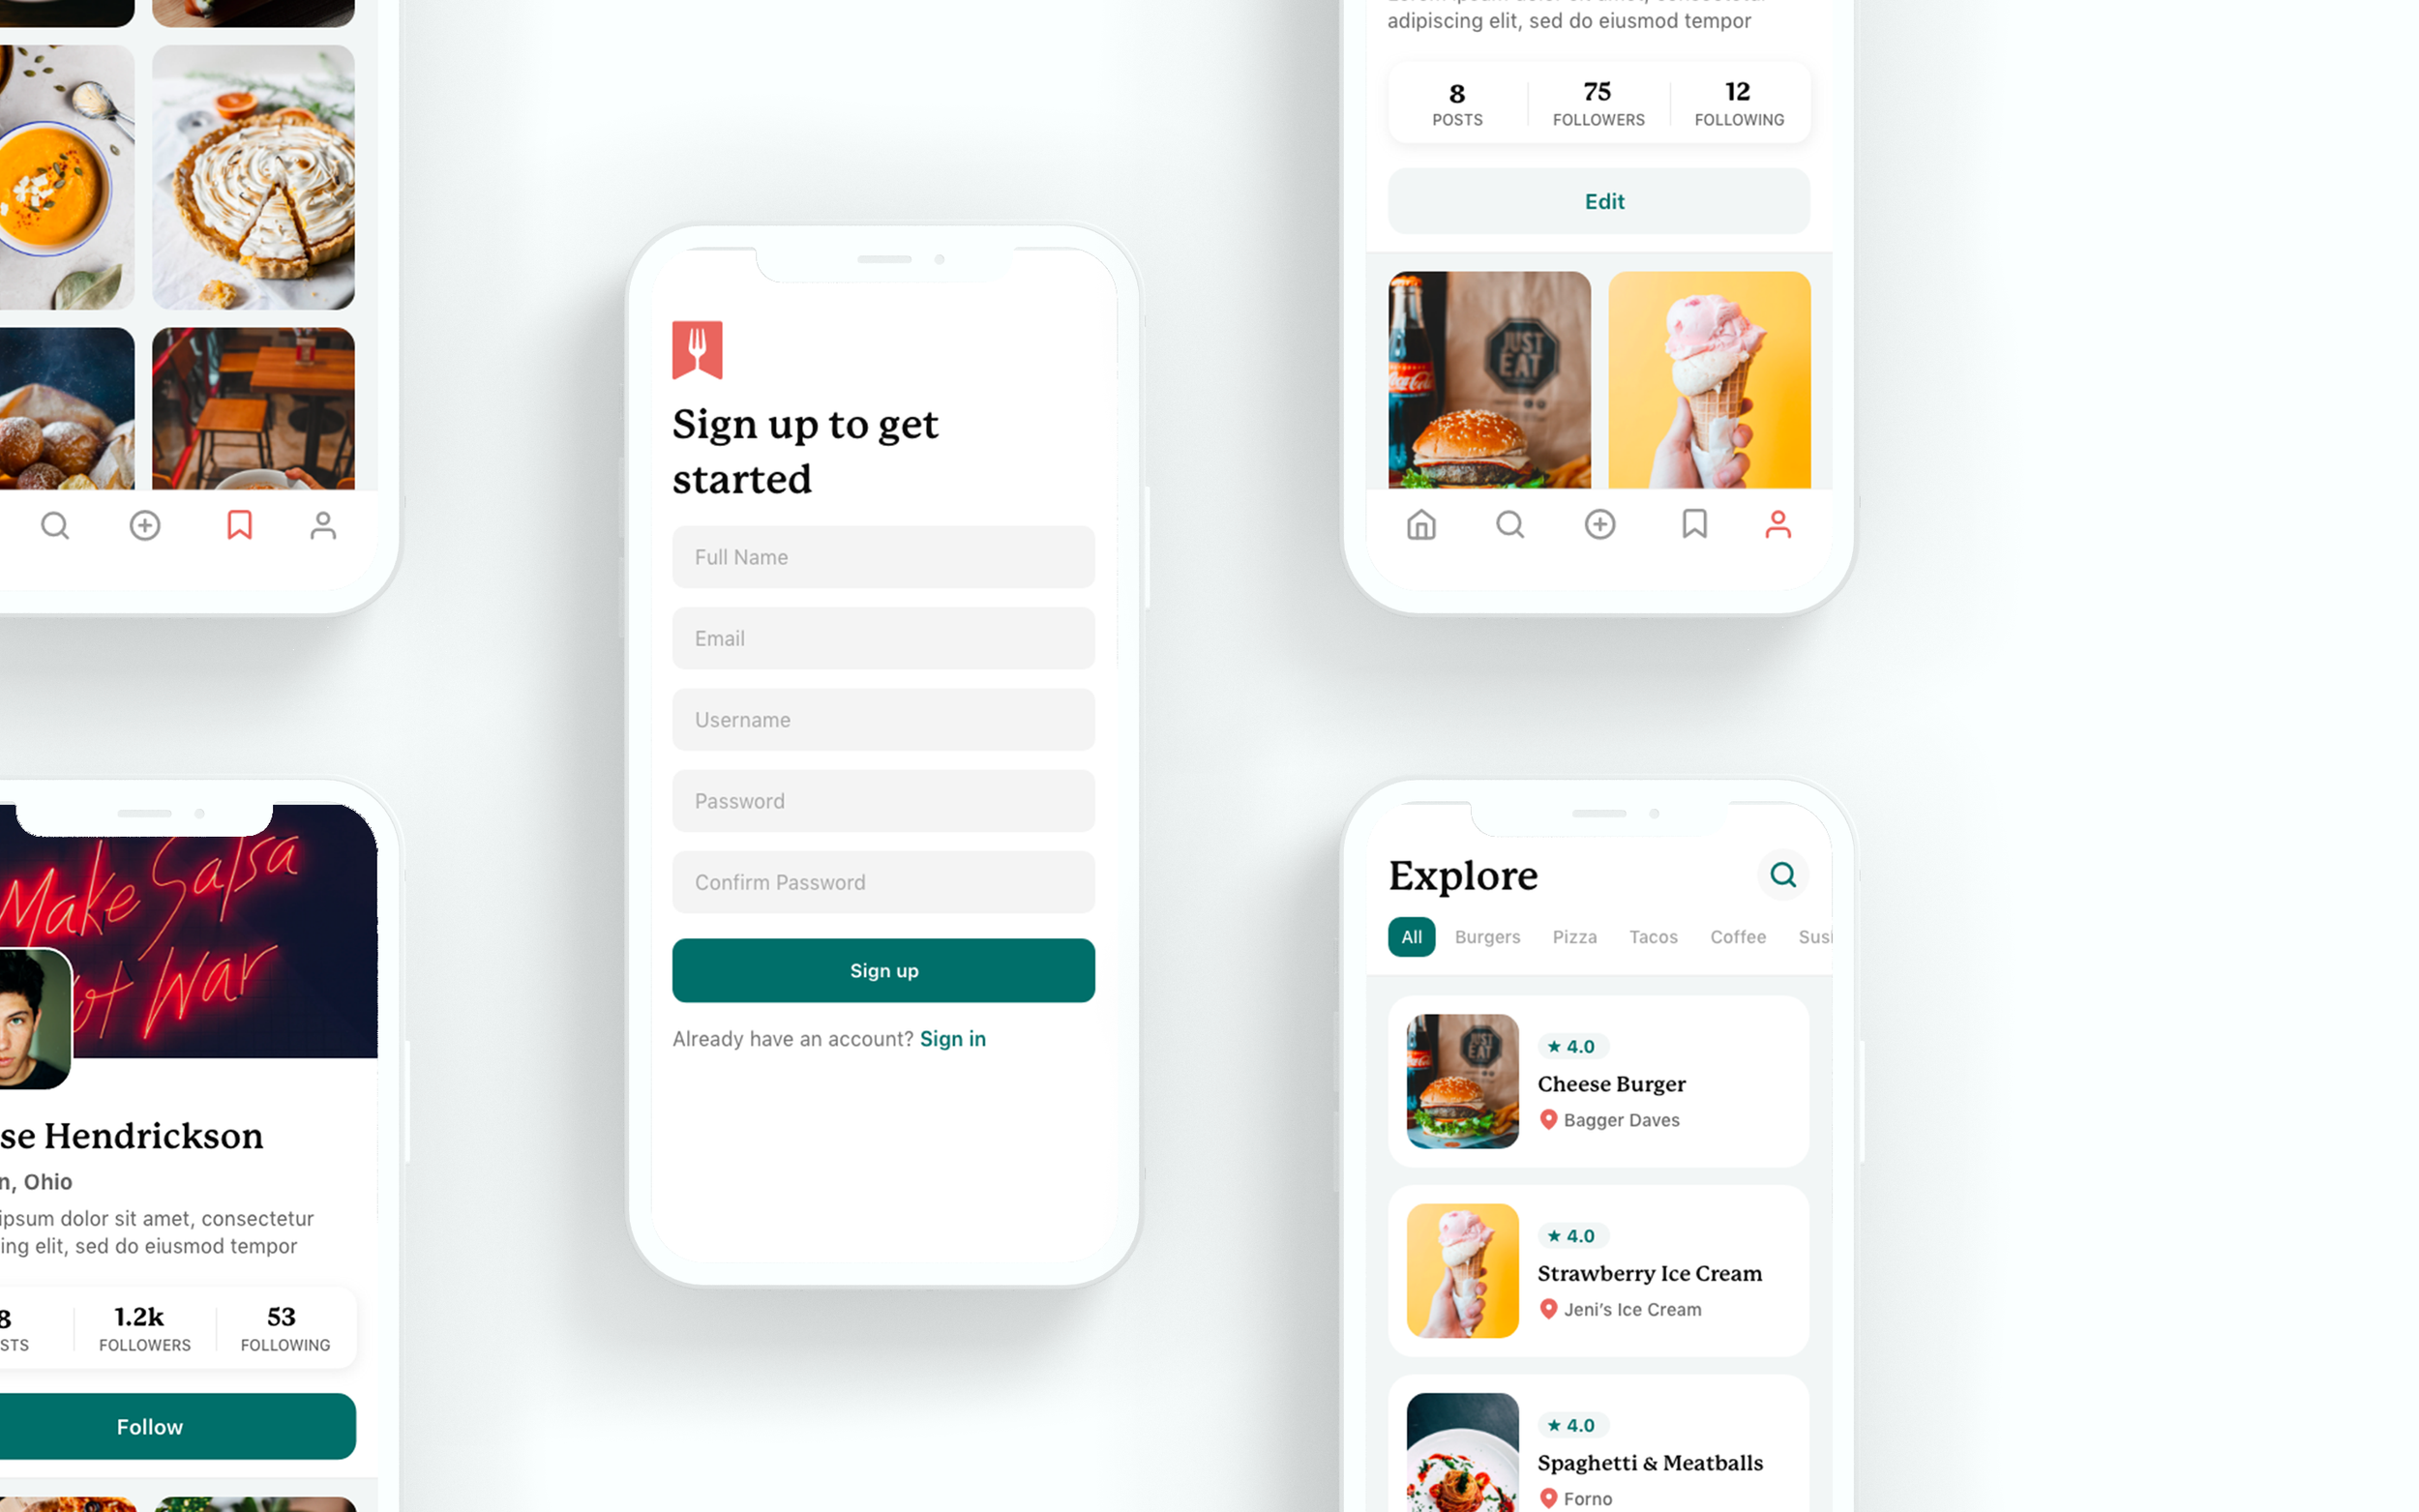
BiteMap
Food Application

Tech Scout
Social Network